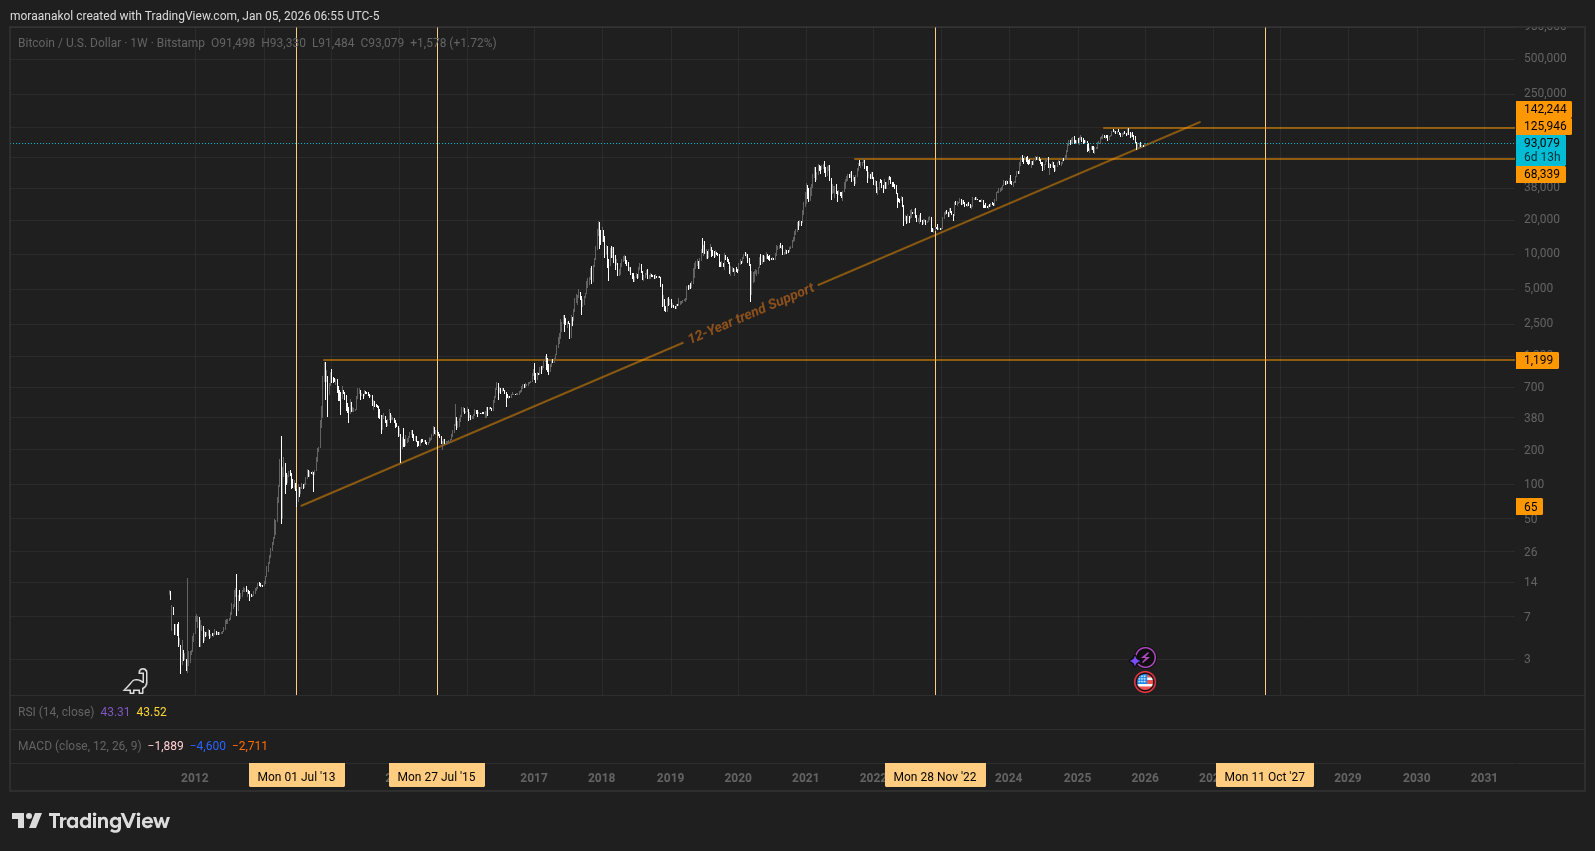
In the world of technical analysis, many search for short-term signals while ignoring the structural bedrock of the market. There exists a Bitcoin trendline that has remained in place for 12 years. It is a line of absolute authority, touched only during the most significant market lows in history.
The 12-Year Touchpoints
Historically, this trend has only been validated by clear, generational lows. These are the specific nodes that marked the beginning of every major Bitcoin bull run:
- 2013
- 2015
- 2022
- 2025
Each of these years represents a moment where the “Algorithm” returned to its primary support to gather the energy required for a massive upward expansion.
Each of these years represents a moment where the “Algorithm” returned to its primary support to gather the energy required for a massive upward expansion.
The Mystery of the 2018–2021 Gap
If you look closely at the chart between the 2018 peak and the 2021 peak, you will notice something peculiar: this 12-year trend was never touched.
Many analysts struggle to explain why the market didn’t return to this baseline during those years. The answer lies in the structural complexity of the market’s movements.
Do you know why?
Because it was a weekly running flat pattern that originated from the 2015 low and was tested at the 2022 low. This Bitcoin trend has been going on for 12 years.
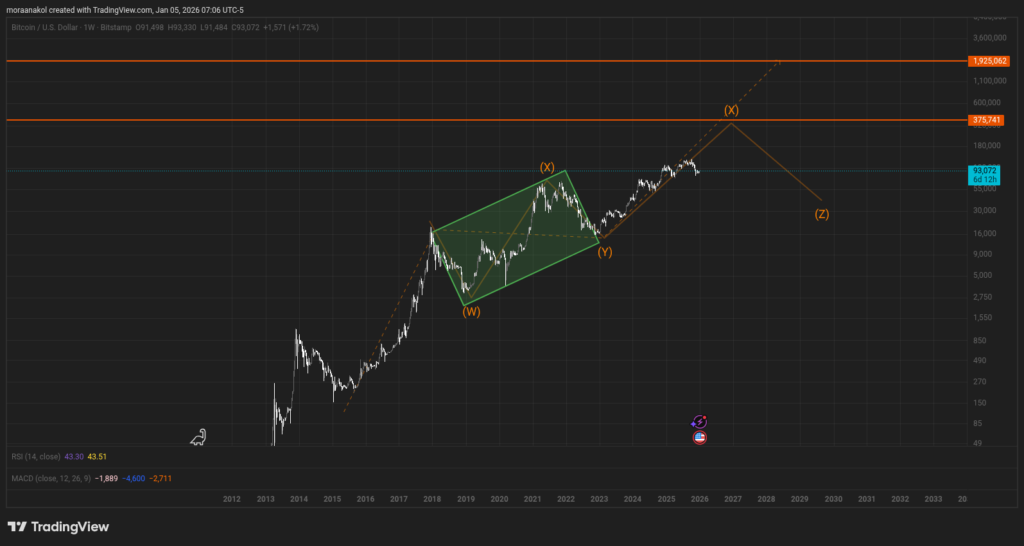
This is the annual running flat pattern that has formed since 2015.
But its target is far off, between 2040 and 2043.
This is what the whales are targeting.
And we will be among them. This is a fact, not a dream. We are not dreaming here.
The Programmed Reality:
- Current Cycle: Between 257,000 and 370,000.
- Next Cycle (2034 Peak): Between 800,000 and 1 million.
- 2040 – 2043 Target: Between 1.7 million and 1.9 million.
The pattern’s target will be driven by international institutional adoption, and this is a programmed reality.